Help Desk Call Project
The goal of this project was to first log three months data from Help Desk support calls that I received as an agent and second to draw conclusions from analyzing the collected information. Below are the details of my findings.
Description:
-
This line graph represents the number of daily calls I received from June through August.
-
I used Tableau to automatically calculate how many lines belong to each individual date and it plotted it on the illustration.
Analysis:
-
The dashed line in the middle of the graph represents the average number of calls over the three months and it started at 30 in June, and steadily declined to around 28 by the end of August.
-
June 26th had the highest total of calls with 58 and July 31st had the lowest with 10. From this I remembered that there a property software outage on June 26th, which led to a high number of callers Also, I worked an evening (4pm-12am) shift on July 31st, and it was a Sunday, which is the least busiest day of the week (see graph below), so this explains the low call total.
Calls Over Time

Description:
-
This bar chart demonstrates the types of calls that I received most frequently
Analysis:
-
The top three most common issues were Folios, Refunds, and Check in/Check out.
-
Calls about CRS (Red Roof Call Center) and Interfaces each only were received about 10 times over 3 months.
-
Callers tend to struggle the most with settling the balance of a guest, especially when a refund is required.
-
This illustration will help me anticipate what kind of requests I'll be most likely to receive in a day so I can prepare ticket templates for them to save time.
Call Category Frequency

Description:
-
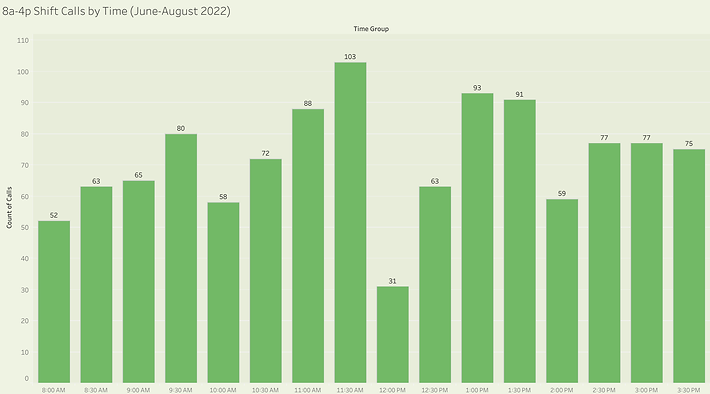
This bar chart shows how busy each 30-minute increment of an 8pm-4pm shift is through out the day.
-
This is a total of calls within each half-hour time frame and not an average.
Analysis:
-
I tend to be the busiest between 11:00am and 2:00pm, especially at 11:30pm.
-
The total for 12:00pm is low because I usually take a 30-minute lunch then. Sometimes I will take lunch at 12:30pm, which explains why it is lower as well.
-
Calls by Time of Day